Nodal metastases status among early stage tongue cancer patients (pT1-pT2) plays a decisive role for choice of treatment, wherein about 70% patients may be spared from surgery with accurate prediction of negative pathological lymph node status. Thus, there is an unmet need for identification of prognostic biomarkers to stratify the early stage tongue cancer patients who are likely to develop metastases. To identify genes and miRNAs implicated in early stage metastasis of tongue cancer, we performed whole transcriptome sequencing and microRNA profiling of early stage tongue tumor samples and metastatic lymph nodes. Further, the candidate genes and miRNAs are being validated in extended cohort of oral cancer patient samples, followed by functional characterization of target genes using in vitro and in vivo studies. Preliminary studies suggest that a matrix metalloproteinase gene, MMP10, and a set of 8 miRNAs could play an important role in invasion and metastasis of oral cancer and could act as potential candidate biomarkers to predict nodal metastasis in early tongue cancer patients.
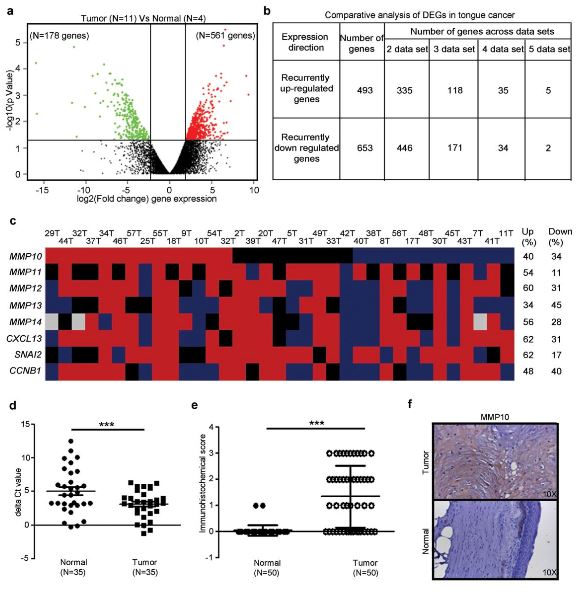
Figure: Differential expression profile of tongue squamous cell carcinoma using mRNA sequencing and meta-analysis identifies MMP10 up regulation.
Differential expression analysis to identify the distinct gene expression profile of tongue tumors. (a) Volcano plot representation of differentially expressed in between early tongue tumors and adjacent normal tongue tissues. The red and green dots denote the up-regulated and down-regulated differentially expressed genes with P value < 0.05 and fold changes ≥ 2 or ≤ -2 for, respectively. (b) The tabular representation of a number of genes overlapped in tongue cancer across different studies. (c) Schematic representation of commonly up-regulated genes qRT-PCR validation in a cohort of 35 paired tongue tumor samples. The Red denotes up-regulation, blue as downregulation, black as basal expression and gray color; experiment could not be done or results could not be acquired. The ≥2 mean fold change is for up-regulation, ≤0.5 mean fold change for down-regulation and in between 1.99-0.501 mean fold change as a basal level expression compared to the adjacent normal tissue sample. (d) qRT-PCR analysis of MMP10 transcript expression in early tongue tumors. Dot plot representation of MMP10 transcript ΔCt value distribution and its significance between normal and tumors tongue tissue sample (n=35). Each dot represents the average normalized ΔCt value of MMP10 in a single sample. Median with interquartile range is shown for MMP10 for normal and tumor samples. (e) Dot plot representation of immunohistochemical score of MMP10 expression in tongue tumors and adjacent normal tissues (n=50). Each dot represents that final IHC score for each sample and median with interquartile range is shown. Median with interquartile range is shown for MMP10 protein expression in normal and tumor samples. (f) Representative IHC stained photomicrographs tongue tumors and paired normal samples are shown. The brown color indicates positive expression of MMP10 protein. The P-value was calculated by Mann- Whitney U test using GraphPad Prism 5 program and p value ≤0.05 was considered as a threshold for statistical significance. P value is denoted as ***; P < 0.0001[5].