DepRanker can be executed with GUI by running DepRanker_GUI from Linux/UNIX shell:
The GUI of DepRanker has two modes which work in an integrated manner for
prioritization of the genes. Module I (pooled shRNA) which allows user to analyze the
RNAi data. User needs to input the hairpin reference file along with the merged fastq
and sample information file. Module II (DepRanker) which takes into input of the files
generated by Module I, along with gene expression and copy number information for
the cell line. Output file of Module II consist of rank impact score for individual genes
along with the scores generated for individual data types (edgeR fold change,
ROAST rank score, gene expression score and copy number score).
Module 1:
Pooled shRNA data analysis using edgeR package provided as GUI can be
executed as follows:
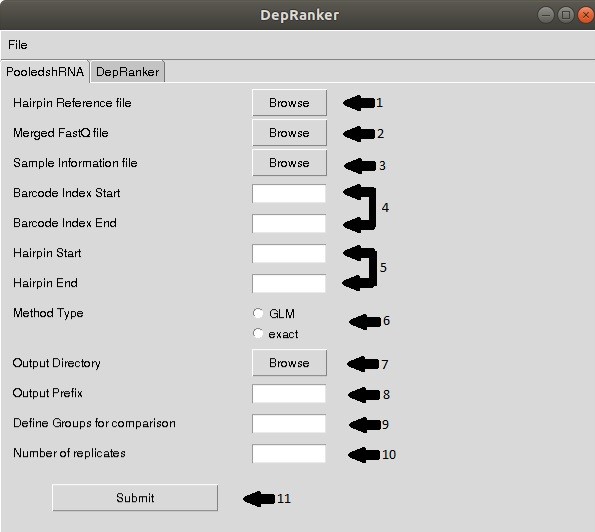
Upon execution of GUI, the above screen will appear with 10 options for user
selection. The user needs to provide following information:
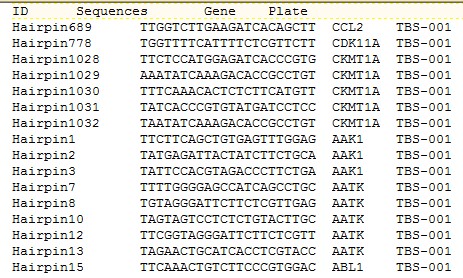
Step 1: Provide shRNA hairpin reference file in the following format.
Step 2: Provide merged Fastq file obtained for raw data. The merged fastq file
comprises of barcode and hairpin sequences of all the time data points. For
example- Day 0 and Day 20 samples.
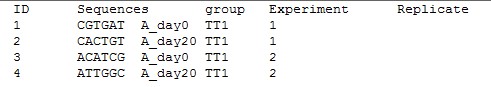
Step 3: Provide sample information file in the following format.
Step 4: As per the barcode length, barcode start and end position in the merged
Fastq has to be specified.
Step 5: Hairpin start and end position in the merged Fastq has to be specified.
Step 6: The analysis method- GLM or Exact test is to be selected.
Step 7: Select output directory for data storage of edgeR analysis.
Step 8: Provide output prefix.
Step 9: Name of the groups to be compared. For example, C,T (for control and test
samples).
Step 10: Provide no of replicates used for the study.
Step 11: Click submit button
Two files will be generated in the output folder. TopTags file consists of all shRNA for
each gene that are ranked according to depletion in the screen. ROAST output file
consist of genes that are ranked by ‘ROAST’ analysis as top depleted or enriched
gene based on p-value and FDR.
For detailed understanding of analysis of pooled screen data by using edgeR
package, users are requested to refer to the article by Zuber et al (2011) –
http://bioinf.wehi.edu.au/shRNAseq/pooledScreenAnalysis.pdf
Module 2:
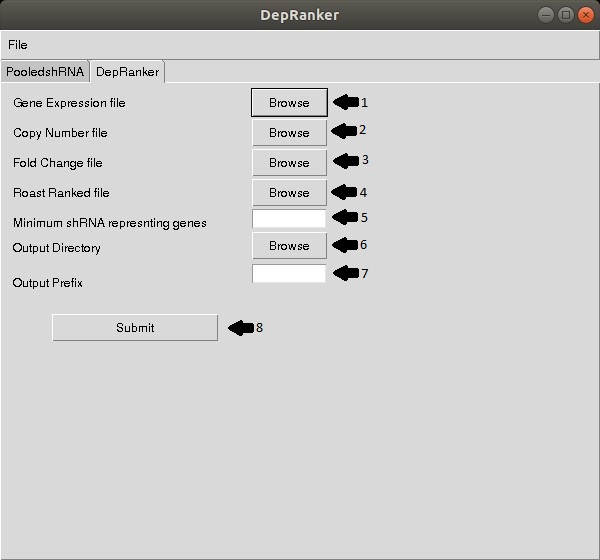
Once the pooled shRNA analysis is done using edgeR and ROAST, the user can run
DepRanker by providing the following information
Step 1: Provide gene expression data file of the cell line if available
Step 2: Provided copy number variation data file for the cell line if available.
Step 3: Select Toptags hairpin file generated from previous module.
Step 4: Select ROAST gene ranking file generated from previous module.
Step 5: Provide filtration criteria of number of shRNA supporting gene to be
considered for further analysis (optional).
Step 6: Provide output directory.
Step 7: Provide output prefix.
Step 8: Click submit button
The user will obtain a list of depleted genes with Ranker impact score (RIS)
calculated. RIS is sum of mean rank scores of individual data parameters of gene
expression, copy number, ROAST ranking and shRNA fold depletion given by
edgeR.